Show Me the Money: Linking the S&OP Shipment Plan to the Financial Revenue Plan.
- DBM

- Feb 5, 2019
- 5 min read
Updated: Nov 17, 2022
A printable PDF of this article is available here.
S&OP is all about “Units”… or is it? Linking the S&OP plan to the financial plan opens a whole new set of management opportunities and at the end of the day the Revenue Plan is important to management, isn’t it?
The S&OP family plan must be stated in units rather than Revenue. Only three sections of the 5-Section Sheet can be stated in units and revenue: Bookings, Shipments and Backlog. It does not make sense to look at the Supply (Production) plan or Inventory plan in terms of Revenue dollars1,2. While all five sections of the 5-Section Sheet must be in common units it is possible, in fact desirable, to develop a view of the first three sections in revenue dollars as well. This is the first step in developing a complete linkage between S&OP and the financial plan.
In this article I will focus on how to convert the Shipment plan into revenue dollars. Similar logic can also be applied to the Bookings plan and the Backlog plan. These conversions should be done at the demand stream level. I have used two demand streams in this article: Flow Demand and Abnormal Demand1,3. The Flow Demand Plan is based on historical data and the Abnormal Demand Plan is based on specific opportunities typically taken from an opportunity management or CRM tool.
Flow Demand
Let’s look at Flow Demand first. The following chart shows the future plan for Flow Demand:
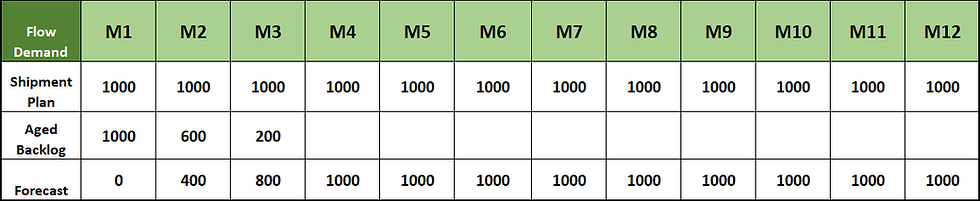
In this chart we see the total shipment plan is 1,000 units per month for the next 12 months, with M1 being the first month of the plan. This total is made of the aged backlog, (open customer orders bucketed by promise date) and the forecast shipments. Notice in the first period, M1, there is no forecast as the total shipment plan is made up by customer orders in the backlog.
The simplest approach to converting this “Units” plan to “Revenue” is to multiply it by an Average Unit Price or AUP. If we used at AUP of $200, then the “Revenue” plan derived from this “Units” plan would look like this:

The 1,000 units per month translates to $200,000 worth of shipments per month using the AUP across the board. While this approach is simple, we actually have better information about the backlog. The backlog is made up of actual customer orders which all have specific pricing and values. Using the actual “Revenue” plan for the backlog improves the quality of the translation.
In the following example, the forecast portion of the plan has been converted using the AUP of $200 and the aged backlog is stated at actual value:
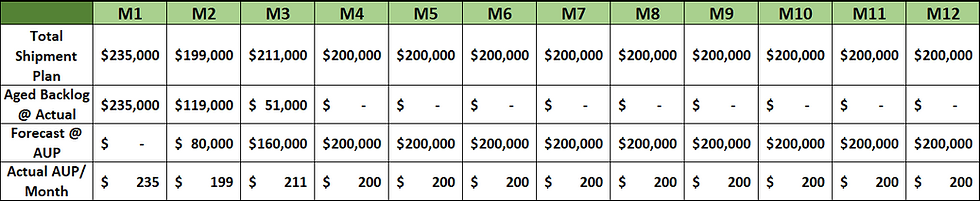
Notice that the AUP in M1of $235 is higher than cumulative AUP of $200. This may be due to mix shifts within the family or some aberrations in pricing. We see a similar phenomenon in M2 where the AUP of $199 is less than $200. In addition to the variables in M1, M2 is also impacted by the blend of the backlog at actual pricing and forecast at the global AUP of $200.
The other factor that could affect this conversion is a planned price increase in the future. If we need to plan for a price increase then we would need to state the forecast AUP by month. In the following example, the AUP has been increased to $220 in month 6 (M6) reflecting planned 10% price increase.
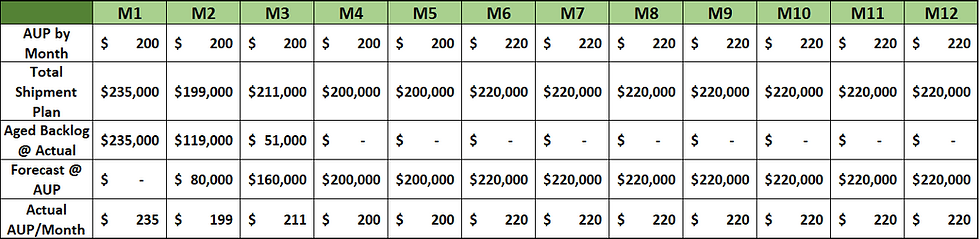
We now have a good conversion of the Flow demand stream from “Units” to Revenue”. Using actual backlog pricing and forecasting future changes to the AUP significantly improves the quality of the conversion from “Units” to “Revenue”.
Abnormal Demand
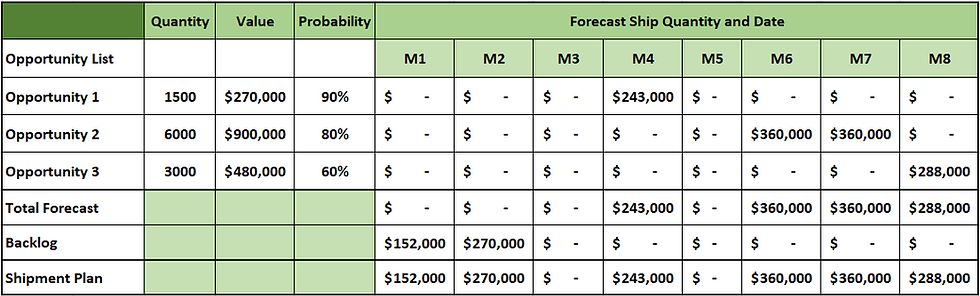
The shipment plan for abnormal demand is developed by summarizing individual opportunities and the abnormal demand backlog. The following chart shows a simplified example of future opportunities for a family. For Opportunity 2, the quantity of the opportunity if it is won is 6000 units. These 6000 units would have a total price of $900,000 based on how it is bid or intended to be bid. The forecast probability of winning the opportunity is 80% and the expected ship dates are half in Month 6 and half in month 7. As a result, we see a shipment forecast for this opportunity of 2400 units in month 6, which is half of 80% of the 6000 units. The other half going into month 7.

Totaling this data by month and adding the backlog we can generate the shipment plan for Abnormal demand in units.

To convert this demand stream into revenue we must take the backlog at actual price and the forecast portion would be based on the value of each individual opportunity multiplied by its probability. The next chart shows what this shipment plan would look like using this approach. I have only gone out 8 months with this chart as there is no demand past month 8.
Combine Flow and Abnormal Demand
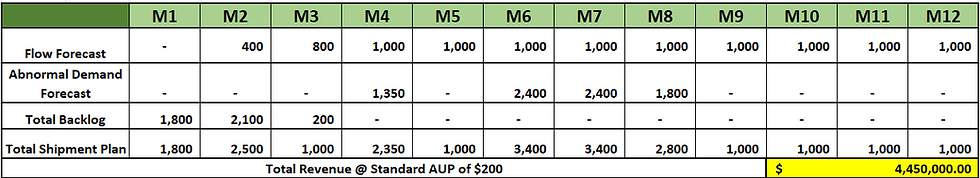
Now all that remains is to combine the Flow and Abnormal Demand stream results. In the following diagram, the Flow Demand and Abnormal Demand stream forecasts have been combined with the total backlog resulting in the total shipment plan in Units for this family. The total Shipments for the 12-month period are 22,250 units. Applying a standard AUP across the board would give us a total value of $4,450,000.
On the other hand, if we look at the financial plan using the revenue numbers calculated at the demand stream level, we get the following results:
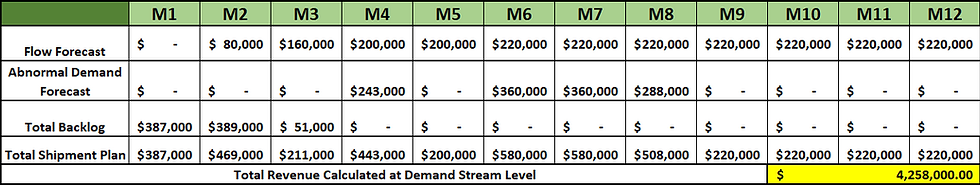
In this case the total revenue plan comes out to $4,258,000. This is a difference of $192,000, or 4.3% which for most financial executives is too much.
Let’s summarize what we just did:
1. We converted the shipment forecast from Units to Revenue at the demand stream level.
For Flow demand we used the AUP and the future expected AUP to do this.
For Abnormal demand we used the forecast opportunity value for each unique opportunity and applied probability percentage.
2. We added and converted the backlog, (open customer orders) based on the actual price for each of the orders in the backlog for each demand stream.
3. We summarized these financial numbers to develop the financial view of the shipment plan going forward.
The S&OP shipment plan should represent the Units that you expect to ship. If it does, you can use this logic to develop the equivalent revenue plan. You may take a more conservative revenue plan to “The Street” but this is what you really expect based on your S&OP plan.
Appendix
The 5-Section Sheet is our standard method of assembling and presenting the S&OP family data. For an in depth understanding of the 5-Section Sheet please refer to the book Sales and Operations Planning; How to Run an S&OP Process Everyone Understands. This book covers the mechanics of the 5-Section Sheet in detail. The book also covers the concept of demand streams and the differences between flow and abnormal demand.
Learn more about how you can use the 5-Section Sheet through the DBM S&OP Tool to implement a sustainable S&OP.
Our article, Are 2 Demand Streams Better Than 1?, provides an overview of the difference between Flow and Abnormal demand.
How effective is your S&OP?
Evaluate your process and get recommendations.
At DBM Systems, our consultants have over 20 years of experience providing S&OP leadership to businesses worldwide. We equip teams with coaching and the tools needed to run an effective S&OP process. Learn about our process and unlock the power of S&OP in your organization.


